Our Automatic Weather Station was installed in Acton Bridge, Cheshire, England, 53.3°N 2.6°W 38m ASL.
Pardoe.Net Meteo index page ;
Monthly Charts of rainfall and temperature, year to date, and Commentary
Here are some links to our other chart pages, and a table of statistics recorded at Acton Bridge from present back to 2008. Towards the bottom of this page are the 30-year average statistics from Met Office Shawbury and Woodford stations ; most recent data are towards the top of the tables (i.e. listed in reverse chronological order).
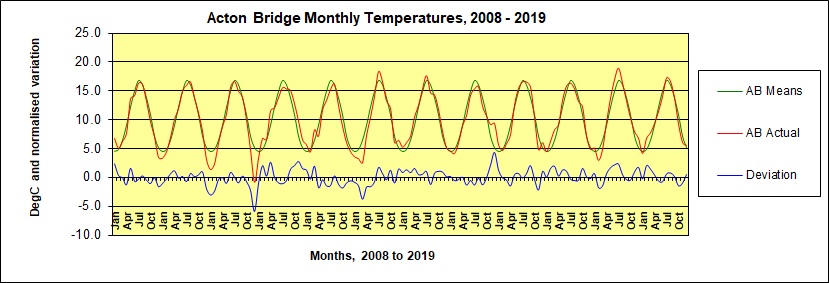
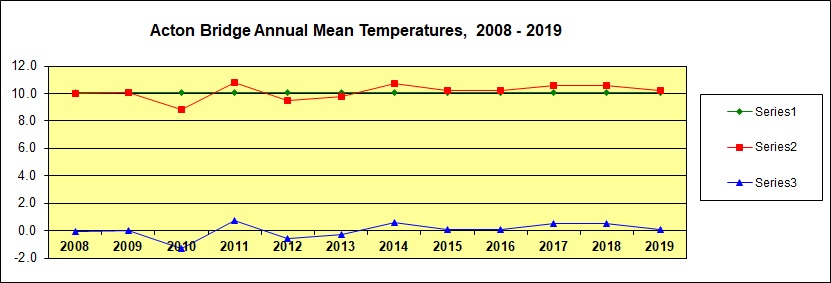
The following charts (updated January 2020) show the last 12 years' monthly and annual temperatures plotted (in red) against the (green, repeating) 2008 - 2019 12-year Acton Bridge averages, with our recorded deviation from average plotted in blue to the same scale. Notice (in blue) the exceptionally cold December 2010 (-0.8°C) and the exceptionally mild December 2015 (+9.4°C, more than 10° warmer than 2010). The lower chart shows the annual averages and deviations (for example, 2014 was 0.8° milder than our 12-year average of 10.1°C).
 |
 |
The chart below shows two rainfall series - the purple is our 11-year 2009-2019 months' averages for the Acton Bridge 5" rain gauge ; the dark blue is the actual 2019 monthly rainfall. Eight of the twelve months were wetter than our average (several being exceptionally so) making 2019 our wettest year on record.

The next chart shows annual rainfall at Acton Bridge compared with our 11-year average of 893mm. At 1,200mm, the overall rainfall for 2019 was 34% above normal, and the wettest we have ever recorded.

|
Annual and Monthly Temperature and Rainfall Statistics from Acton Bridge, from the present year back to 2008, most recent first.
|
| Monthly records, 2008 to present | T Mean °C Highest | T Mean °C Lowest | T Max °C Highest | T Min °C Lowest | Rain mm Wettest | Rain mm Driest | ||
| Data and Month | 19.0°C July 2018 | -0.8°C December 2010 | 32.4°C July 2020 | -13.9°C January 2010 | 187.6mm October 2008* | 4.6mm June 2018 | ||
| The coloured backgrounds above are pointers to specific data in the tables below. *187.6mm record rainfall in October 2008 was measured with VP2 Tipping Bucket ; highest rainfall measured with Copper 5-Inch Gauge was 181.3mm in October 2020. |
||||||||
| Months, 2020 | T Mean °C (average) | T Max °C | T Min °C | Rain mm (average) | Commentary |
| October 2020 | 10.2 (10.8) | 17.8 | +4.2 | 181.3 (78.3) | Slightly Cool and Extraordinarily Wet - the highest-ever rainfall in our 12+ years of recording |
| September 2020 | 13.6 (13.7) | 27.6 | +1.7 | 38.3 (78.3) | Average Temperature and Very Dry |
| August 2020 | 16.8 (16.0) | 30.9 | +4.6 | 132.2 (79.3) | Mild and Extremely Wet |
| July 2020 | 15.3 (16.7) | 32.4 | +6.0 | 82.8 (85.9) | Slightly Cool, Average for Rain; record high temperature on the 31st |
| June 2020 | 15.2 (14.9) | 29.9 | +7.1 | 180.5 (73.0) | Average Temperature and Extraordinarily Wet (5" Rain Gauge) |
| May 2020 | 13.0 (12.2) | 26.8 | -1.4 | 8.0 (59.8) | Mild and Extremely Dry |
| April 2020 | 10.5 (9.0) | 22.1 | -1.3 | 20.7 (51.6) | Mild and Very Dry |
| March 2020 | 6.6 (6.4) | 18.2 | -2.4 | 44.6 (64.2) | Average Temperature and Rather Dry |
| February 2020 | 6.2 (4.8) | 13.4 | -1.9 | 152 (55.3) | Mild and Exceptionally Wet |
| January 2020 | 6.4 (4.5) | 13.4 | -1.8 | 64.6 (81.2) | Very Mild and Rather Dry |
| Year Summary, 2019 | 10.2 | 32.3 on 25. July | -5.6 on 1. January | 1,199.6 | Average Temperature and Extremely Wet, an 11-year record for Acton Bridge |
| Months, 2019 | T Mean °C | T Max °C | T Min °C | Rain mm | Commentary |
| December 2019 | 5.6 | 12.4 | -3.6 | 82.7 | Very Mild and Rather Dry |
| November | 6.1 | 14.4 | -4.1 | 113.1 | Cool and Very Wet |
| October | 9.3 | 16.4 | -0.3 | 129.7 | Cool and Very Wet |
| September | 13.8 | 22.8 | +4.9 | 135.6 | Average Temperature and Extremely Wet |
| August | 16.7 | 30.3 | +8.6 | 99.0 | Mild and Wet |
| July | 17.3 | 32.3 | +8.3 | 163.7 | Average Temperature and Exceptionally Wet |
| June | 14.1 | 29.1 | +6.1 | 138.6 | Average Temperature and Exceptionally Wet |
| May | 11.5 | 21.7 | +2.6 | 78.4 | Slightly Cool and Slightly Dry |
| April | 9.4 | 25.8 | -1.8 | 78.4 | Average Temperature and Very Wet |
| March | 7.8 | 20.1 | -0.8 | 119.0 | Mild and Extremely Wet |
| February | 6.8 | 19.5 | -5.4 | 39.5 | Very Mild and Dry |
| January 2019 | 4.2 | 12.1 | -5.6 | 51.0 | Average Temperature and Very Dry |
| Year Summary, 2018 | 10.6 | 31.9 on 26. June | -6.8 on 26. February | 726.1 | Mild and Rather Dry |
| Month, 2018 | T Mean °C | T Max °C | T Min °C | Rain mm | Commentary |
| December | 6.8 | 14.1 | -1.8 | 99.8 | Very Mild and Rather Wet |
| November | 8.0 | 14.6 | -2.6 | 36.3 | Mild and Dry |
| October | 10.3 | 21.9 | -2.3 | 45.4 | Average Temperature and Quite Dry |
| September | 13.3 | 24.8 | +2.9 | 104.2 | Average Temperature and Very Wet |
| August | 14.4 | 24.8 | +8.1 | 73.5 | Average Temperature and Rainfall |
| July | 19.0 | 30.1 | +8.8 | 40.0 | Very Warm and Dry |
| June | 17.0 | 31.9 | +6.7 | 4.6 | Very Warm and Extraordinarily Dry |
| May | 13.8 | 27.4 | +0.5 | 25.8 | Mild and Very Dry |
| April | 9.6 | 25.3 | +1.2 | 80.6 | Normal Temperature and Very Wet |
| March | 4.9 | 13.8 | -5.4 | 80.9 | Cold and Very Wet |
| February | 3.0 | 10.8 | -6.8 | 45.5 | Cold and Dry |
| January | 5.1 | 14.8 | -3.6 | 84.5 | Slightly Mild and Average Rainfall |
| Year Summary, 2017 | 10.6 | 31.1 on 19. June | -5.7 on 12. December | 982 | Mild and Wet |
| Month, 2017 | T Mean °C | T Max °C | T Min °C | Rain mm | Commentary |
| December | 4.9 | 12.8 | -5.7 | 107.1 | Mild and Rather Wet |
| November | 7.2 | 15.9 | -0.9 | 102.8 | Normal Temperature and Rather Wet |
| October | 12.3 | 20.2 | -0.6 | 95.3 | Very Mild and Rather Wet |
| September | 13.2 | 22.0 | +5.5 | 140.9 | Slightly Cool and Extremely Wet |
| August | 15.4 | 23.7 | +6.9 | 92.1 | Slightly Cool and Rather Wet |
| July | 16.4 | 27.1 | +8.6 | 80.6 | Normal Temperature and Rather Wet |
| June | 15.9 | 31.1 | +7.9 | 82.6 | Warm and Wet |
| May | 13.4 | 27.9 | +2.3 | 35.0 | Warm and Very Dry |
| April | 9.2 | 21.8 | -0.3 | 25.6 | Normal Temperature and Very Dry |
| March | 8.3 | 17.6 | -1.8 | 95.3 | Mild and Very Wet |
| February | 6.3 | 15.7 | -1.5 | 65.5 | Mild, Wet and Very Windy later |
| January | 4.5 | 11.7 | -5.2 | 68.1 | Average Temperature and Rainfall |
| Year Summary, 2016 | 10.3 | 30.7 on 19. July | -4.6 on 29. November | 895 | Slightly Mild and Slightly Wet |
| Month, 2016 | T Mean °C | T Max °C | T Min °C | Rain mm | Comment |
| December | 6.1 | 14.3 | -2.4 | 46.8 | Very Mild and Dry |
| November | 4.9 | 15.1 | -4.6 | 112.8 | Very Cold and Very Wet |
| October | 10.4 | 17.8 | +1.9 | 28.0 | Normal Temperature and Very Dry |
| September | 15.7 | 26.4 | +6.5 | 52.6 | Very Mild and Slightly Dry |
| August | 16.8 | 26.8 | +7.9 | 53.6 | Rather Mild and Dry |
| July | 16.6 | 30.7 | +7.7 | 62.0 | Rather Mild and Dry |
| June | 15.5 | 26.8 | +5.1 | 117.3 | Mild and Very Wet |
| May | 12.6 | 25.0 | +2.9 | 48.9 | Slightly Mild and Rather Dry |
| April | 7.5 | 17.2 | -1.6 | 88.5 | Cool and Very Wet |
| March | 5.9 | 14.8 | -3.3 | 83.7 | Cool and Wet |
| February | 4.7 | 13.8 | -4.4 | 70.2 | Average Temperature, and Wet |
| January | 5.7 | 13.8 | -3.3 | 128.1 | Mild and Very Wet |
| Year Summary, 2015 | 10.2 | 30.1 | -3.2 | 818 | Rather Cool and Slightly Dry |
| Month, 2015 | T Mean °C | T Max °C | T Min °C | Rain mm | Comment |
| December | 9.4 | 15.1 | -0.1 | 94.4 | Extraordinarily Mild and Quite Wet |
| November | 9.2 | 17.8 | -2.2 | 136.2 | Very Mild and Very Wet |
| October | 10.7 | 19.3 | +2.2 | 47.3 | Average Temperature and Dry |
| September | 12.4 | 20.9 | +2.7 | 40.6 | Cool and Dry |
| August | 15.8 | 24.7 | +5.8 | 69.2 | Average Temperature and Rainfall |
| July | 15.4 | 30.1 | +5.2 | 82.0 | Cool and Wet |
| June | 14.3 | 29.1 | +3.4 | 36.2 | Average Temperature and Rather Dry |
| May | 10.8 | 19.6 | -0.1 | 91.8 | Cool and Very Wet |
| April | 9.1 | 21.2 | -1.6 | 21.3 | Average Temperature and Very Dry |
| March | 6.0 | 15.6 | -2.7 | 82.6 | Cool and Very Wet |
| February | 4.2 | 11.8 | -2.9 | 37.2 | Average Temperature and Rather Dry |
| January | 4.6 | 14.4 | -3.2 | 90.3 | Mild and Rather Wet |
| Year Summary, 2014 | 10.8 | 28.2 | -3.3 | 900 | Rather Mild and Slightly Wet |
| Month, 2014 | T Mean °C | T Max °C | T Min °C | Rain mm | Comment |
| December | 5.2 | 13.5 | -3.3 | 109.1 | Very Mild, Rather Wet |
| November | 8.0 | 14.8 | +0.2 | 57.0 | Mild, Rainfall Below Average |
| October | 11.8 | 20.7 | +2.2 | 86.8 | Mild, Normal Rainfall |
| September | 14.4 | 22.9 | +5.1 | 10.1 | Mild and Extraordinarily Dry |
| August | 14.7 | 23.4 | +5.6 | 127.3 | Cool and Extremely Wet |
| July | 17.7 | 28.2 | +7.8 | 47.6 | Very Warm and Relatively Dry |
| June | 15.4 | 25.3 | +4.3 | 48.8 | Mild and Slightly Dry |
| May | 12.6 | 23.8 | +1.4 | 93.0 | Normal Temperature, Very Wet |
| April | 10.4 | 19.5 | +0.6 | 48.7 | Slightly Mild, Normal Rainfall |
| March | 7.2 | 19.5 | -2.6 | 53.9 | Normal Temperature and Rainfall |
| February | 6.1 | 12.3 | -0.1 | 84.1 | Mild, Very Wet, and Windy |
| January | 5.4 | 11.0 | -1.2 | 133.5 | Mild and Exceptionally Wet |
| Year Summary, 2013 | 9.6 | 30.1 | -5.6 | 853 | Normal Temperature & Slightly Dry |
| Month, 2013 | T Mean °C | T Max °C | T Min °C | Rain mm | Comment |
| December | 6.5 | 12.8 | -1.6 | 69.1 | Very Mild and Rather Dry |
| November | 6.1 | 13.4 | -3.5 | 68.8 | Cold and Rather Dry |
| October | 12.0 | 20.1 | +3.5 | 158.1 | Mild and Exceptionally Wet |
| September | 13.3 | 24.9 | +4.9 | 55.0 | Slightly Cool and Dry |
| August | 16.6 | 28.8 | +8.5 | 53.0 | Relatively Warm and Dry |
| July | 18.4 | 30.1 | +9.2 | 69.0 | Hot, and slightly (but unevenly) dry |
| June | 14.1 | 23.8 | +5.1 | 65.9 | Normal for temperature and rainfall |
| May | 10.5 | 23.1 | +0.1 | 81.2 | Cold and Wet |
| April | 7.3 | 18.3 | -4.3 | 17.9 | Cold and Extremely Dry |
| March | 2.6 | 12.5 | -5.5 | 64.8 | Exceptionally Cold and Very Wet |
| February | 3.3 | 10.9 | -2.9 | 56.2 | Cold and Slightly Wet |
| January | 3.6 | 13.2 | -5.1 | 82.2 | Cool and Wet |
| Year Summary, 2012 | 9.6 | 27.3 | -6.0 | 1,156 | Slightly Cool & Very Wet |
| Month, 2012 | T Mean °C | T Max °C | T Min °C | Rain mm | Comment |
| December | 4.5 | 12.4 | -5.2 | 168.4 | Average Temp and Exceptionally Wet |
| November | 6.1 | 14.9 | -2.5 | 95.2 | Cool and Wet |
| October | 8.9 | 15.0 | -0.3 | 76.3 | Cool and Slightly Dry |
| September | 12.5 | 24.1 | +0.9 | 167.9 | Cool and Exceptionally Wet |
| August | 16.2 | 25.8 | +5.3 | 89.1 | Average Temp and Rather Wet |
| July | 15.3 | 27.3 | +6.6 | 97.0 | Cool and Very Wet |
| June | 13.4 | 24.1 | +5.7 | 146.7 | Cool and Exceptionally Wet |
| May | 11.7 | 26.7 | -0.8 | 70.5 | Cold at First & Rather Wet, then Warm & Dry |
| April | 7.2 | 17.7 | -1.3 | 108.1 | Cool and Extremely Wet |
| March | 8.3 | 21.2 | -0.6 | 23.5 | Very Mild and Very Dry |
| February | 4.5 | 16.9 | -6.0 | 44.2 | Slightly Dry |
| January | 5.7 | 13.0 | -3.4 | 69.2 | Mild and Slightly Wet |
| Year Summary, 2011 | 10.8 | 28.2 | -6.5 | 759.6 | Mild and Slightly Wet |
| Month, 2011 | T Mean °C | T Max °C | T Min °C | Rain mm | Comment |
| December | 6.7 | 14.3 | -1.1 | 133.7 | Very Mild and Very Wet |
| November | 9.8 | 15.9 | -1.6 | 39.8 | Very Mild and Dry |
| October | 12.8 | 28.2 | +2.1 | 85.9 | Very Mild and Rather Wet |
| September | 15.1 | 27.5 | +7.0 | 31.6 | Mild and Dry |
| August | 15.4 | 26.4 | +7.8 | 75.1 | Rather Wet |
| July | 15.6 | 26.3 | +5.4 | 69.8 | Rather Wet |
| June | 13.9 | 27.9 | +3.8 | 80.5 | Rather Wet |
| May | 12.1 | 22.1 | +1.3 | 69.4 | Slightly Mild and Rather Wet |
| April | 11.6 | 24.6 | +0.9 | 19.9 | Exceptionally Mild and Very Dry |
| March | 6.6 | 18.4 | -3.3 | 16.7 | Slightly Mild and Exceptionally Dry |
| February | 6.8 | 14.7 | -1.2 | 81.1 | Mild and Wet |
| January | 3.4 | 12.5 | -6.5 | 56.1 | Cold and Very Dry |
| Year Summary, 2010 | 8.8 | 29.3 | -13.9 | 643.1 | Cool and Rather Dry |
| Month, 2010 | T Mean °C | T Max °C | T Min °C | Rain mm | Comment |
| December | -0.8 | 8.3 | -13.6 | 21.4 | Exceptionally Cold and Very Dry |
| November | 4.8 | 17.2 | -8.5 | 62.6 | Slightly Cool, Rainfall Normal |
| October | 10.0 | 19.3 | -2.7 | 80.8 | Temperature Normal, Wet |
| September | 13.9 | 23.2 | 4.6 | 85.4 | Temperature Normal, Wet |
| August | 15.0 | 24.3 | 5.1 | 89.8 | Temperature Normal, Very Wet |
| July | 16.7 | 27.5 | 8.6 | 84.4 | Temperature Normal, Very Wet |
| June | 15.7 | 28.4 | 4.4 | 26.4 | Warm and Very Dry |
| May | 11.1 | 29.3 | -0.7 | 28.6 | Temperature Normal, Very Dry |
| April | 8.9 | 20.0 | -1.8 | 28.2 | Slightly Warm, Dry |
| March | 6.0 | 15.4 | -6.8 | 36.8 | Temperature Normal, Dry |
| February | 2.4 | 9.9 | -3.9 | 53.5 | Cold and Wet |
| January | 1.4 | 9.5 | -13.9 | 45.2 | Very Cold, Rainfall Normal |
| Year Summary, 2009 | 10.1 | 28.9 | -6.7 | 751.5 | Slightly Mild and Wet |
| Month, 2009 | T Mean °C | T Max °C | T Min °C | Rain mm | Comment |
| December | 3.1 | 11.9 | -6.2 | 65.4 | Cold, Rainfall Normal |
| November | 8.0 | 16.2 | -1.3 | 150.2 | Mild, Exceptionally Wet |
| October | 11.2 | 20.3 | 1.3 | 34.8 | Mild and Dry |
| September | 13.8 | 23.5 | 6.0 | 28.8 | Temperature Normal, Very Dry |
| August | 16.6 | 24.6 | 8.9 | 46.0 | Temperature Slightly Warm, Dry |
| July | 16.0 | 28.9 | 8.2 | 146.3 | Temperature Normal, Exceptionally Wet |
| June | 15.0 | 27.2 | 3.8 | 57.8 | Mild, Rainfall Normal |
| May | 12.0 | 24.8 | 3.4 | 72.2 | Mild and Wet |
| April | 10.1 | 20.4 | 0.4 | 42.4 | Very Mild, Rainfall Normal |
| March | 7.0 | 16.6 | -2.6 | 34.0 | Mild and Dry |
| February | 4.5 | 10.8 | -4.2 | 18.6 | Temperature Normal, Very Dry |
| January | 3.4 | 10.6 | -6.7 | 55.1 | Cool, Rainfall Normal |
| Year Summary, 2008 | 10.0 | 26.9 | -6.2 | 836.1 | Slightly Mild and Very Wet |
| Month, 2008 | T Mean °C | T Max °C | T Min °C | Rain mm | Comment |
| December | 3.5 | 12.1 | -5.3 | 71.4 | Cold, Rainfall Normal |
| November | 7.0 | 13.3 | -2.8 | 66.5 | Normal |
| October | 9.7 | 19.2 | -1.6 | 187.6 | Temperature Normal, Exceptionally Wet (VP2 Tipping Bucket Gauge) |
| September | 13.2 | 20.3 | 5.6 | 92.7 | Temperature Normal, Wet |
| August | 16.2 | 23.5 | 7.2 | 91.2 | Temperature Normal, Wet |
| July | 16.4 | 26.9 | 7.8 | 93.0 | Temperature Normal, Wet |
| June | 14.2 | 23.9 | 5.2 | 67.5 | Temperature Normal, Rainfall Above Normal |
| May | 13.7 | 26.8 | 2.9 | 46.7 | Very Warm, Rainfall Below Normal |
| April | 7.7 | 18.1 | -2.6 | 94.8 | Temperature Normal, Very Wet |
| March | 6.3 | 13.9 | -2.3 | 72.1 | Temperature Normal, Rainfall Above Normal |
| February | 5.1 | 14.3 | -6.2 | 44.4 | Mild, Rainfall Normal |
| January | 6.8 | 13.7 | -0.8 | 80.0 | Exceptionally Mild, Rainfall Above Normal |
| Month | T Mean °C | T Max °C | T Min °C | Rain mm | Comment |
Pardoe.Net Meteo index page ;
Numerical summary page ;
Monthly Charts of rainfall and temperature, year to date, and Commentary
Website ©
Steve & Judy Pardoe
Cheshire, England

[Site directory]
[Home page]